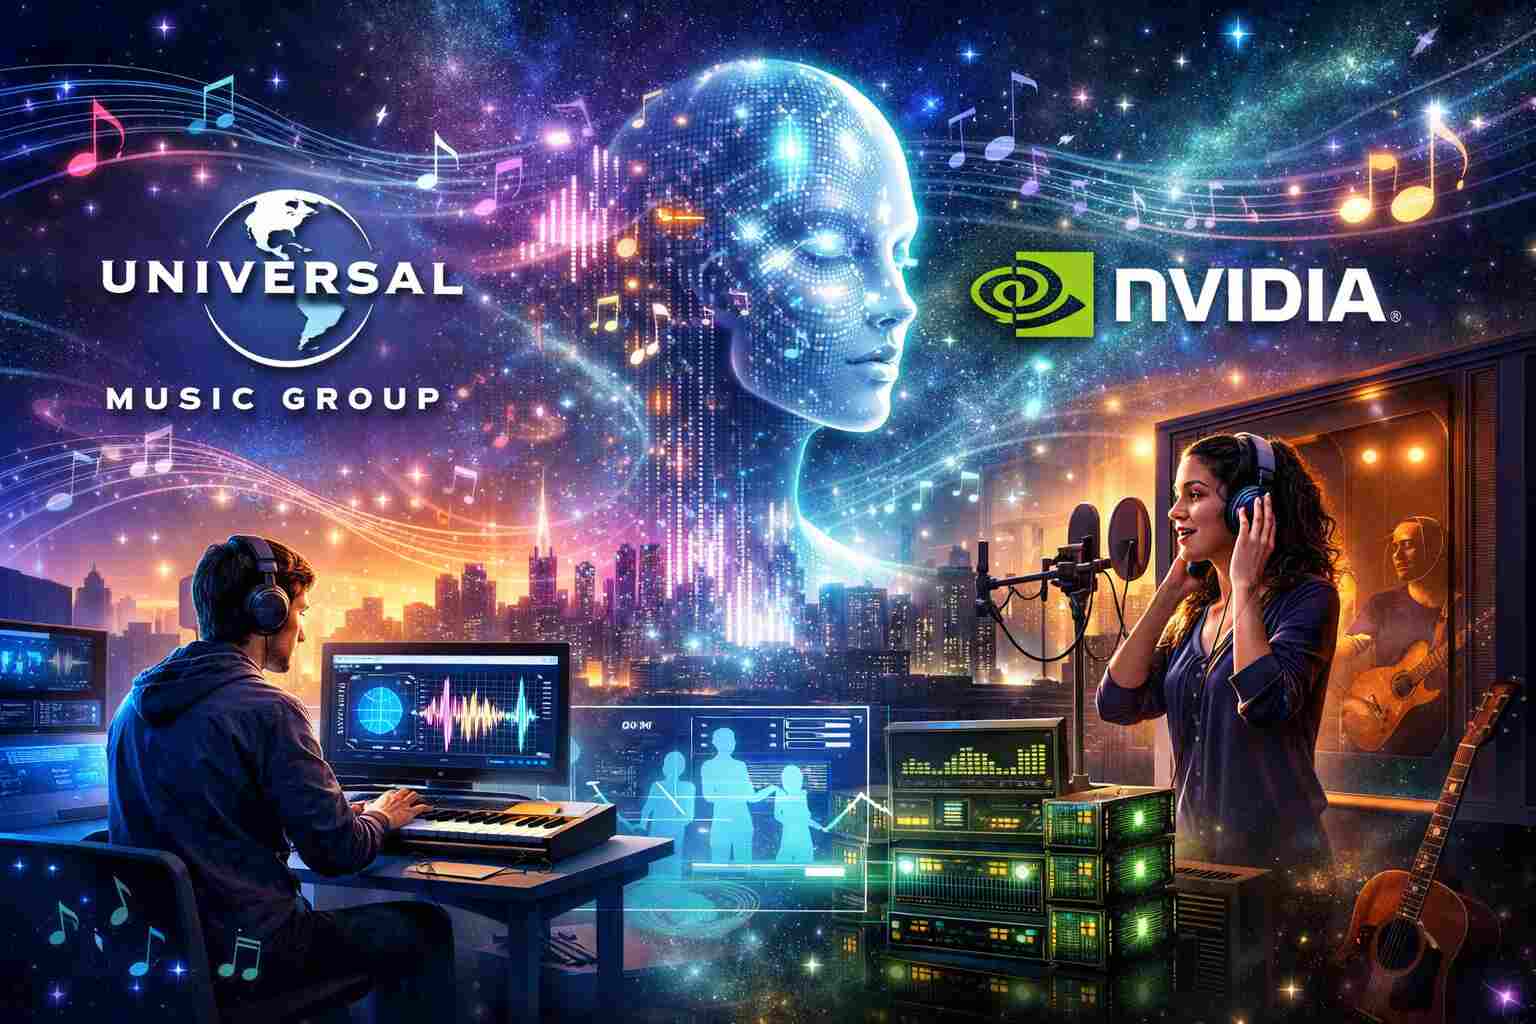
Chaopeng Shen and Yalan Song

Supercomputer models may help prevent the next catastrophe, an expert says. AI simulations aim to improve flood warnings as the Central Texas tragedy deepens

The death toll from a devastating flash flood in Central Texas rose above 100 as of Monday evening, with officials reporting at least 104 confirmed fatalities and several dozen individuals still unaccounted for, including some 11 people from a single summer camp where 27 campers and staff are known to have died. Among the missing are children from Camp Mystic in Kerr County, where heavy rain and flash flooding washed away cabins and swept young lives into a ravaging river that surged 26 feet in just 45 minutes.

As grief-stricken communities search for answers and survivors, scientists at Penn State University are warning that without faster, more accurate flood forecasting systems, tragedies like these may repeat. In a breakthrough announced just days ago, a team led by Penn State civil and environmental engineers unveiled an AI-powered supercomputer model that significantly improves predictions of flood severity, location, and timing across the continental United States system referred to by its creators as a high‑resolution differentiable hydrologic and routing model combines decades of river‑gauge data, basin parameters, and weather observations with neural networks guided by physical hydrology. Traditional models, such as NOAA's National Water Model (NWM), require tedious calibration at each site, a process that can be highly inefficient and slow, particularly across thousands of river basins.

In contrast, the Penn State team's approach trains once on 15 years of streamflow data from 2,800 USGS stations, then deploys its learned network broadly, yielding 30 percent greater accuracy in streamflow forecasts across approximately 4,000 gauge stations, including those outside the training set. The model is exceptionally skilled at handling extreme rainfall events, avoiding the underestimation that pure machine learning models risk when encountering rare outliers.

The payoff is dramatic: tasks that once required weeks and multiple supercomputers can now be completed in hours on a single system. Simulating 40 years of high‑resolution flow data now takes mere hours—not weeks—potentially providing emergency managers crucial lead time before a flash flood strikes.

Pushback remains: integrating neural networks into operational systems, such as NOAA's NWM, demands independent validation and confidence in AI decision logic. Yet researchers emphasize that their "physics‑informed" hybrid design offers both superior speed and interpretability—a rare combination in flood forecasting technology.

A Nation Stunned by Swift Destruction

On the morning of July 4, Central Texas was struck by one of the deadliest floods in the state's history. Torrential storms deposited more than a foot of rain in fewer than 12 hours, saturating the western Guadalupe River basin. Overnight, the river rose at an alarming speed, sweeping away homes, cabins, vehicles, and lives in its path—particularly at Camp Mystic near Hunt, Texas.

Search and rescue teams deployed helicopters, boats, and drones in a desperate effort to find survivors, but time passed painfully as the death toll climbed past 100. Officials warned that the chance of finding more survivors was quickly fading. Grief and anger spread among families demanding better early warning systems—systems that might have prevented people from being in harm's way altogether.

Meeting the Moment with Supercomputing Power

The Penn State modeling initiative, supported by its Institute for Computational and Data Sciences (ICDS) and backed by leading universities and agencies (including NOAA and the Department of Energy), showcases how cutting‑edge supercomputing can accelerate flood risk understanding and preparedness across broad regions.

Chaopeng Shen and Yalan Song, the Penn State researchers co‑leading the effort, emphasize that beyond flood forecasting, their tool can help predict drought, soil moisture, groundwater recharge, and other hydrologic metrics vital for water resource management and agricultural resilience. Their model's ability to generalize across geographic regions makes it a promising candidate for integration into next-generation iterations of the National Water Model, potentially enhancing lead time and clarity in emergency alerts.

From Tragedy to Transformation

Central Texas mourns deeply as communities grapple with colossal loss—Camp Mystic staff and campers alone accounted for 27 deaths, with 11 individuals still missing, as of late Monday. Local families, responders, and officials have collapsed under the emotional and operational strain of a disaster that progressed too fast for conventional warning systems.

The Penn State model offers a glimmer of hope: a future where supercomputers and AI combine to give people time to evacuate or prepare—not just minutes, but possibly hours or days of advanced warning before floodwaters rise.

As disaster response continues in Texas, this dual narrative—of human tragedy and scientific promise—should prompt policymakers, funders, and technologists to ask: How can we accelerate the deployment of tools that could help prevent another flood from unfolding at such devastating speed?

The Road Ahead

The Penn State team is already in conversation with NOAA and other stakeholders to explore pilot deployments. However, widespread adoption will depend on validating performance in diverse geographies and demonstrating reliability under stress. The urgency to act has never been more apparent. As flood fatalities climb and the nation watches, harnessing the power of AI and supercomputing to predict and mitigate disaster is no longer hypothetical; it is imperative.

English researchers reveal how forests collapsed, leading to the extinction of various forms of life

In a groundbreaking revelation, analyses aided by supercomputers, combined with fossil discoveries, are transforming our understanding of Earth’s most catastrophic mass extinction event: the Permian-Triassic extinction. Approximately 252 million years ago, life on Earth faced its greatest challenge with a mass extinction event known as the "Great Dying," which wiped out around 90% of all species.

Recent studies from the University of Leeds emphasize that a sudden collapse of ecosystems can lead to lasting climate upheaval. Scientists warn that history may serve as a chilling reminder of our own vulnerable geological era.

🌍 Vegetation collapse, super-greenhouse state

According to a report from Leeds University, newly discovered plant fossils indicate that tropical forests disappeared suddenly during the Permian-Triassic boundary approximately 252 million years ago. This event was not merely a case of deforestation; it represented a catastrophic tipping point. The loss of vegetation significantly reduced the Earth's ability to absorb CO₂, leading to a feedback loop that established extreme greenhouse conditions for millions of years.

Harnessing supercomputers to model Earth’s past

At the core of this discovery is advanced supercomputer modeling. Researchers input paleobotanical data, which includes information on plant diversity, distribution, and productivity, into intricate Earth-system simulations that integrate soil, vegetation, ocean chemistry, and atmospheric dynamics. These models require processing power far beyond that of traditional tools and can simulate millions of years of climate in high detail.

The simulations reveal that once forests collapse, the planet enters a perilous state of energy imbalance. Dark, barren land absorbs more solar radiation, carbon dioxide (CO₂) accumulates without vegetation to capture it, and this creates a feedback loop that drives the climate into a prolonged "super-greenhouse" phase lasting for five to ten million years.

An ominous warning for our era

The connection to our current situation is concerning. Just as the collapse of ancient forests led to significant climate tipping points, today's deforestation and changes in land use could unintentionally trigger similar irreversible feedback loops. While modern supercomputers allow for high-resolution climate projections, these new studies remind us that even the most advanced models, which are informed by fossil evidence, reveal delicate thresholds that we risk crossing.

Why it matters

  • Feedback dynamics: These models demonstrate how biosphere collapse can amplify climate change far beyond initial triggers.
  • Resilience shattered: Ancient ecosystems took millions of years to recover; our current pace of change offers little time for such rebound.
  • Modeling as a lifeline: Only with advanced supercomputing can we untangle these complex climate–biosphere interactions and perhaps build a safeguard.

Final thoughts

This groundbreaking work is not just a journey into deep time; it serves as a stark warning. The same critical mechanisms that once propelled Earth into a prolonged super-greenhouse state are, alarmingly, within our ability to trigger today. Supercomputers, fossil records, and climate science are coming together to raise the alarm: without urgent intervention, modern land use could destroy vital carbon sinks, leading us to a tipping point that reshaped life 252 million years ago.

The urgent nature of these data-driven models demands our attention. The greatest computational achievement in modeling ancient climates may ultimately provide the clearest forecast for our planetary future.

Deep models fuse for Webb's cosmic discovery of exoplanet

The James Webb Space Telescope (JWST) has made a groundbreaking discovery: it has directly imaged a new exoplanet, TWA 7 b. This is the first time a planet has been directly imaged by JWST since its launch in 2021.

The planet TWA 7 b is about 110 light-years away in the constellation Antlia and is a Saturn-sized gas giant. It is also the least massive exoplanet ever directly imaged, at about 0.3 Jupiter or 100 Earth masses, a feat made possible by Webb’s Mid-Infrared Instrument (MIRI) and its French-built coronagraph.

TWA 7 b orbits a young star that is only 6 million years old. The star is located 52 AU (astronomical units) away from TWA 7 b, which is within a dusty debris disk composed of concentric rings.

Deep learning models are being used to help researchers understand the data that JWST has collected. These models can be trained on large datasets of exoplanet observations, which allows them to make predictions about the exoplanets. Deep learning models can also analyze the data, which helps researchers determine which exoplanets are most likely to support life.

The JWST has opened up a new frontier for exoplanet exploration. It is capable of finding smaller, colder, and more distant exoplanets than were previously detectable. The JWST and deep learning models are powerful tools for exploring our universe.

The JWST discovery of the exoplanet TWA 7 b is the result of the convergence of deep learning and Webb's telescope observations. This convergence shows the potential for discovery that is unlocked when we combine powerful tools with human curiosity and ingenuity.

Orbiting a mere 6‑million-year-old star at ~52 AU, TWA 7 b resides within a dusty debris disk composed of concentric rings, potentially shepherded by yet-unseen companions.

With less than 2% of known exoplanets directly imaged, Webb’s leap marks a breakthrough in discovering colder, more distant, and lower-mass worlds.

“Webb opens a new window—in terms of mass and the distance of a planet to the star of exoplanets that had not been accessible to observations so far,” said Anne‑Marie Lagrange.

Though worlds apart in scale, both stories share a theme: seeing the unseen, whether it's particles dancing in a supercomputer or a newborn planet hidden in starlight.

  • Supercomputer modeling provides the theoretical scaffolding that guides experimental design and interpretation what conditions to recreate, what signals to seek.
  • On the other end, Webb’s discovery offers empirical validation real-world snapshots of cosmic phenomena that can inform simulation parameters or even inspire new models.

Combined, they show how virtual and observational science are converging each advances the other. Simulations refine telescope targets; telescope images validate and challenge simulations. Step by step, we’re decoding nature’s most elusive puzzles from the wildest weather patterns on Earth to the birth of worlds in distant star systems.

Looking Ahead

  • For simulations: Future goals include smarter algorithms that maintain precision but eat far less power unlocking even more complex virtual experiments.
  • For exoplanet exploration: Webb’s coronagraphic success is just the beginning, the hunt is now on for smaller, colder worlds, moving ever closer to those that could, someday, harbor life.

In a thrilling week for science, supercomputers and telescopes alike are expanding humanity's gaze be it into the microscopic mechanics of Earth, or the swirling rings and fledgling giants of other star systems. Two very different journeys, but united by one curiosity: to uncover the secrets hidden in the unseen.

Illustration of the pulsar viewing geometry in Cartesian coordinates using the angles of ζ = 25° and α = 35° in the magnetic frame. The magnetic axis is aligned with the zb-axis, and the line-of-sight (LOS) and the rotation axis are indicated by the green and red arrows, respectively. Also drawn is the boundary of an open-field region (dotted gray), centered at the magnetic pole. The orientation is chosen so that the magnetic axis, the rotation axis and the line-of-sight all lie in the xb − zb plane at ψ = 0°. At this phase, the visible point is located at {θbV,  ϕbV}={6.7° , 0° }, as indicated by the blue dot.

Chinese researchers build high-stakes simulations or high-risk overreach?

Chinese Academy of Sciences (CAS) researchers stirred headlines and skepticism with a press release touting cutting-edge supercomputer simulations modeling cosmic gas dynamics around massive star clusters. A peer‑reviewed study in Astronomy & Astrophysics (May 2025) uses a computational approach to dissect the turbulence and fragmentation in stellar nurseries. But do these simulations chart a path toward understanding star formation, or inflate what we can compute into what we meaningfully know?

Inside the CAS announcement

  • The claim: Using an unnamed Chinese supercomputer and magnetohydrodynamic (MHD) models, the team simulated turbulence-driven cloud collapse and feedback processes, such as stellar winds and radiation pressure, to reproduce observed gas structures in star-forming regions.
  • The red flags: The press release is heavy on evocative imagery (“continuously braided gas filaments,” “shocks carving cavities”), and light on hard data. It mentions “detailed” simulation but offers no benchmarks comparing the output to real telescope measurements or alternative models. Hardware specifics? GPU count? Node types? Missing.

The A&A article delivers a quantitative deep dive. The researchers ran high-resolution, 3D turbulent-cloud MHD simulations across parameterized density regimes, assessing fragmentation scales and mass distribution. They compare their simulated filament widths and fragmentation spacing to actual observations, showing modest agreement within a factor of two.

Yet even this rigorous approach confronts limitations: simplified chemistry (no full CO cooling network), neglect of cosmic rays, and spatial resolution that skirts the threshold of critical fragmentation scales. The paper cautions that adding self-consistent radiative transfer or small-scale turbulence triggers could significantly alter results, in which case, their conclusions remain provisional.

The CAS press release blurs supercomputational muscle with scientific breakthroughs. But raw FLOPS aren’t scientific rigor. Without transparent code, parameters, or error bars, the claims read more like marketing copy than methodical discovery.

Could it be simply that flashy visualizations substitute for astrophysical insight? A Nature-oriented source notes that even U.S. exascale efforts (e.g., HACC on Frontier rely on simplified “kitchen-sink” physics and still require careful calibration and often fall short of real-world fidelity space. If even DOE-backed teams struggle to link simulation to observation, one wonders what exactly the CAS group has accomplished.

Conclusion

Simulations undeniably help astrophysics, no one denies that. But claims should be rooted in transparency, data benchmarks, and reproducibility. Without reporting key details, initial conditions, convergence tests, and code availability, the CAS release looks premature, perhaps even overhyped. Until the group publishes its methodology and results in a peer-reviewed venue, their “breakthrough” remains just another dazzling computer graphic, hard to verify, easy to question.

Simulations are vital tools, but they’re not truth machines. Without rigorous publication and comparative analysis, exascale hype remains hollow.

Dr Anshuman Bhardwaj (left), Baoling Gui (centre) and Dr Lydia Sam

AI breakthrough at the University of Aberdeen to enhance global environmental monitoring

A pioneering team at the University of Aberdeen in Scotland has introduced an AI model named SAGRNet, which can potentially transform environmental and agricultural monitoring worldwide.

Developed by Dr. Lydia Sam, Dr. Anshuman Bhardwaj, and their colleagues, SAGRNet—short for Sampling and Attention-based Graph Convolutional Residual Network—utilizes deep learning to map land cover from satellite imagery with greater accuracy and efficiency. Instead of analyzing individual pixels, the model examines entire landscape features, such as forests, fields, and waterways, providing deeper insights into vegetation types and their contexts.

Initially trained on the diverse terrains of northeast Scotland, encompassing habitats ranging from farmland to urban areas, SAGRNet has demonstrated impressive adaptability. It has performed well in various regions worldwide, including Guangzhou (China), Durban (South Africa), Sydney (Australia), New York City (USA), and Porto Alegre (Brazil). The team has made the model open-source so that decision-makers, researchers, and conservationists can implement it in their local contexts.

“Our system of deep learning algorithms can instantly and accurately recognize different types of land cover, vegetation, or crops in an area,” said Dr. Sam.

Significantly, the model provides detailed information while minimizing computational demands—an essential advantage for timely monitoring of climate impacts, such as wildfires, floods, and droughts.

Dr. Bhardwaj emphasized its versatility: “It can also monitor crop growth, facilitating more accurate harvest predictions and helping make better-informed decisions about land-use sustainability.”

PhD researcher Baoling Gui pointed out how seamlessly SAGRNet integrates into operational pipelines, benefiting various applications from ecological studies to national land-use surveys.

This research, published in the prestigious ISPRS Journal of Photogrammetry and Remote Sensing, was supported by the UK’s BBSRC International Institutional Award, with contributions from international collaborators in Spain, and Germany.