

 How to resolve AdBlock issue?
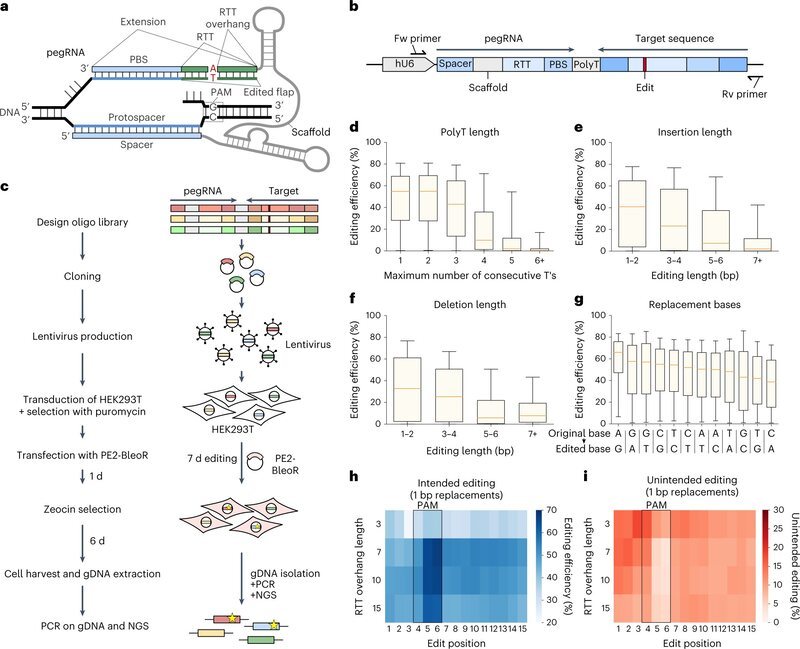
Researchers at the University of Zurich have developed a new tool that uses artificial intelligence to predict the efficacy of various genome-editing repair options. Unintentional errors in the correction of DNA mutations of genetic diseases can thus be reduced.
Genome editing technologies offer great opportunities for treating genetic diseases. Methods such as the widely used CRISPR/Cas9 gene scissors directly address the cause of the disease in the DNA. The scissors are used in the laboratory to make targeted modifications to the genetic material in cell lines and model organisms and to study biological processes.
Further development of this classic CRISPR/Cas9 method is called prime editing. Unlike conventional gene scissors, which create a break in both strands of the DNA molecule, prime editing cuts and repairs DNA on a single strand only. The prime editing guide RNA (pegRNA) precisely targets the relevant site in the genome and provides the new genetic information, which is then transcribed by a “translation enzyme” and incorporated into the DNA.
Finding the most efficient DNA repair options
Prime editing promises to be an effective method of repairing disease-causing mutations in patients’ genomes. However, when it comes to applying it successfully, it is important to minimize unintended side effects such as errors in DNA correction or alteration of DNA elsewhere in the genome. According to initial studies, prime editing leads to a significantly lower number of unintended changes than conventional CRISPR/Cas9 approaches.
However, researchers currently still have to spend a significant amount of time optimizing the pegRNA for a specific target in the genome. “There are over 200 repair possibilities per mutation. In theory, we would have to test every single design option each time to find the most efficient and accurate pegRNA,” says Gerald Schwank, professor at the Institute of Pharmacology and Toxicology at the University of Zurich (UZH).
Analyzing a large data set with AI
Schwank and his research group needed to find an easier solution. Together with Michael Krauthammer, UZH professor at the Department of Quantitative Biomedicine, and his team, they developed a method that can predict the efficiency of pegRNAs. By testing over 100,000 different pegRNAs in human cells, they were able to generate a comprehensive prime editing data set. This enabled them to determine which properties of a pegRNA – such as the length of the DNA sequence, the sequence of DNA building blocks or the shape of the DNA molecule – positively or negatively influence the prime editing process.
Subsequently, the team developed an AI-based algorithm to recognize patterns in the pegRNA of relevance for efficiency. Based on these patterns, the trained tool can predict both the effectiveness and accuracy of genome editing with a particular pegRNA. “In other words, the algorithm can determine the most efficient pegRNA for correcting a particular mutation,” says Michael Krauthammer. The tool has already been successfully tested in human and mouse cells and is freely available to researchers.
Long-term goal: repairing hereditary diseases
Further pre-clinical studies are still needed before the new prime editing tool can be used in humans. However, the researchers are confident that in the foreseeable future, it will be possible to use prime editing to repair the DNA mutations of common inherited diseases such as sickle cell anemia, cystic fibrosis, or metabolic diseases.
The tool can be accessed by researchers at https://pridict.it. The study was supported by the University of Zurich Research Priority Program Human Reproduction Reloaded and the Swiss National Science Foundation.
")


.")
