

 How to resolve AdBlock issue?
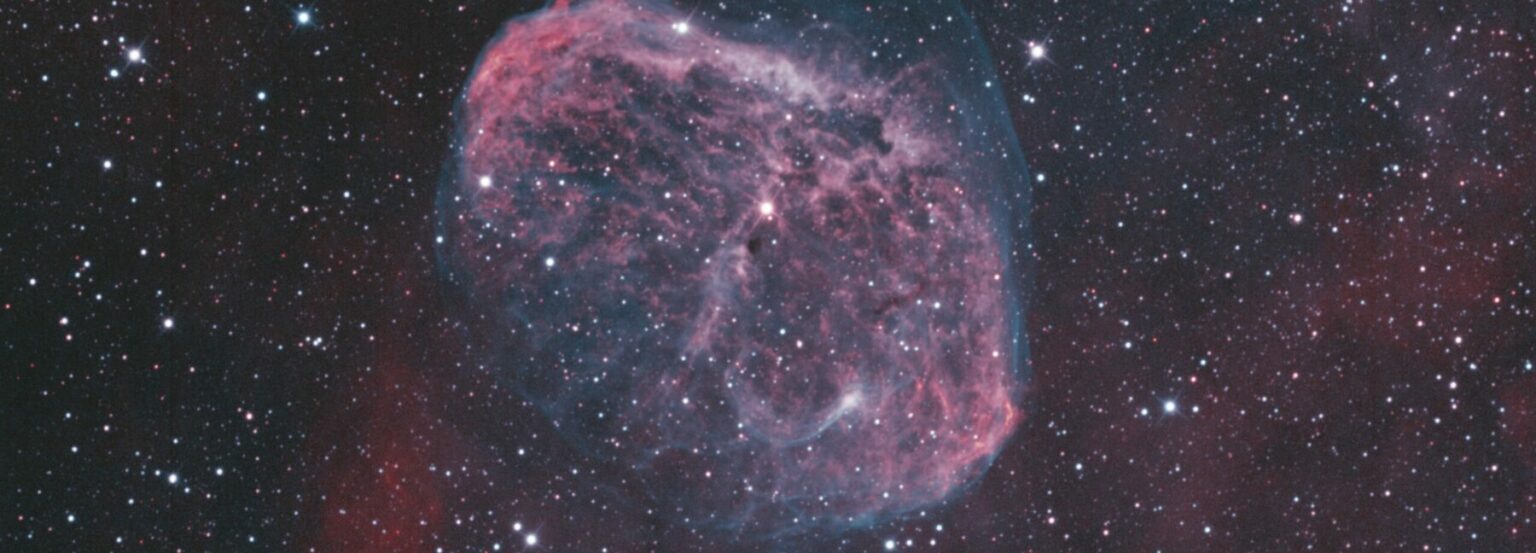
York University and an international team of astrophysicists have made an ambitious attempt to simulate the formation of galaxies and the cosmic large-scale structure throughout staggeringly large swaths of space.
The first results of their new calculations for the “MillenniumTNG” project help to subject the standard cosmological model to precision tests and to unravel the full power of upcoming new cosmological observations, say the researchers including York Assistant Professor Rahul Kannan of the Faculty of Science. , dark matter (top right), and stellar light (bottom center) for a slice in the largest hydrodynamical simulation of MillenniumTNG at the present epoch. The slice is about 35 million light-years thick. The projections show the vast physical scales in the simulation from size, about 2400 million light-years across, to an individual spiral galaxy (final round inset) with a radius of ~150 000 light-years. The underlying calculation is presently the largest high-resolution hydrodynamical simulation of galaxy formation, containing more than 160 billion resolution elements © MPA")
Over the past decades, cosmologists have gotten used to the perplexing conjecture that the universe’s matter content is dominated by enigmatic dark matter and that an even stranger dark energy field, that acts as some kind of anti-gravity, accelerates the expansion of today’s cosmos. Ordinary baryonic matter makes up less than five percent of the cosmic mix, but this source material forms the basis for the stars and planets of galaxies like our own Milky Way.
This seemingly strange cosmological model is known under the name LCDM. It provides a stubbornly successful description of many observational data, ranging from the cosmic microwave background radiation – the rest-heat left behind by the Big Bang – to the “cosmic web,” where galaxies are arranged along an intricate network of dark matter filaments. However, the real physical nature of dark matter and dark energy is still not understood, prompting astrophysicists to search for cracks in the LCDM theory. Identifying tensions with observational data could lead to a better understanding of these fundamental puzzles about the universe. Sensitive tests are required that need both: powerful new observational data as well as more detailed predictions about what the LCDM model implies.
An international team of researchers led by the Max Planck Institute for Astrophysics (MPA) in Germany, Harvard University in the U.S., Durham University in the U.K., and the Donostia International Physics Center in Spain, along with York University, have now managed to take a decisive step forward on the latter challenge. Building upon their previous successes with the “Millennium” and “IllustrisTNG” projects, they developed a new suite of simulation models dubbed “MillenniumTNG,” which trace the physics of cosmic structure formation with considerably higher statistical accuracy than what was possible with previous calculations.
Large simulations including new physical details
The team utilized the advanced cosmological code GADGET-4, custom-built for this purpose, to compute the largest high-resolution dark matter simulations to date, covering a region nearly 10 billion light-years across. In addition, they employed the moving-mesh hydrodynamical code AREPO to follow the processes of galaxy formation directly, throughout volumes still so large that they can be considered representative of the universe as a whole. Comparing both types of simulations allows a precise assessment of the impact of baryonic processes related to supernova explosions and supermassive black holes on the total matter distribution. Accurate knowledge of this distribution is key for interpreting upcoming observations correctly, such as so-called weak gravitational lensing effects, which respond to matter irrespective of whether it is of dark or baryonic type.
Furthermore, the team included massive neutrinos in their simulations, for the first time in simulations big enough to allow meaningful cosmological mock observations. Previous cosmological simulations had usually omitted them for simplicity, because they make up at most one to two percent of the dark matter mass, and since their nearly relativistic velocities mainly prevent them from clumping together. Now, however, upcoming cosmological surveys (such as those of the recently launched Euclid satellite of the European Space Agency) will reach a precision allowing detection of the associated per-cent-level effects. This raises the tantalizing prospect to constrain the neutrino mass itself, a profound open question in particle physics, so the stakes are high.
For their groundbreaking MillenniumTNG simulations, the researchers made efficient use of two extremely powerful supercomputers, the SuperMUC-NG machine at the Leibniz Supercomputing Center in Garching, and the Cosma8 machine at Durham Universe. More than 120,000 computer cores toiled away for nearly two months at SuperMUC-NG, using computing time awarded by the German Gauss Centre for Supercomputing, to produce the most comprehensive hydrodynamical simulation model to date. MillenniumTNG is tracking the formation of about 100 million galaxies in a region of the universe around 2,400 million light-years across (see Figure 1). This calculation is about 15 times bigger than the previous best in this category, the TNG300 model of the IllustrisTNG project.
Using Cosma8, the team computed an even bigger volume of the universe, filled with more than a trillion dark matter particles and more than 10 billion particles for tracking massive neutrinos. Even though this simulation did not follow the baryonic matter directly, its galaxy content can be accurately predicted in MillenniumTNG with a semi-analytic model that is calibrated against the full physical calculation of the project. This procedure leads to a detailed distribution of galaxies and matter in a volume that, for the first time, is large enough to represent the universe as a whole, comparing upcoming observational surveys on a sound statistical basis.


 “moving nest\" Model. Global map showcasing land mass in green and water in black, clouds in white and tropical storms outlined in a green boxes representing the moving nest model. (Image credit: NOAA)")
